CT Body Composition Calculator
Quick Answer
This calculator analyzes your CT scan measurements to calculate Skeletal Muscle Index (SMI), VAT/SAT ratio, and assess sarcopenia risk. Results help athletes and medical professionals evaluate body composition with gold-standard accuracy.
- Calculates SMI: Skeletal Muscle Area ÷ Height² (standardized muscle mass)
- Assesses metabolic risk: VAT/SAT ratio indicates visceral fat distribution
- Sarcopenia screening: Compares against validated clinical thresholds
What is Computed Tomography (CT Scan)?
Computed Tomography, or CT Scan, is a noninvasive, painless medical test used to diagnose and treat medical conditions. It is also commonly called a CAT scan (which stands for computerized axial tomography).
In terms of body composition, the high quality images can be processed to differentiate and measure the amounts of fat and lean body tissue, and further distinguish between intra-abdominal fat (visceral adipose tissue) and extra-abdominal fat (subcutaneous adipose tissue). This makes CT the gold standard for body composition analysis with measurement accuracy of ±2-3%.
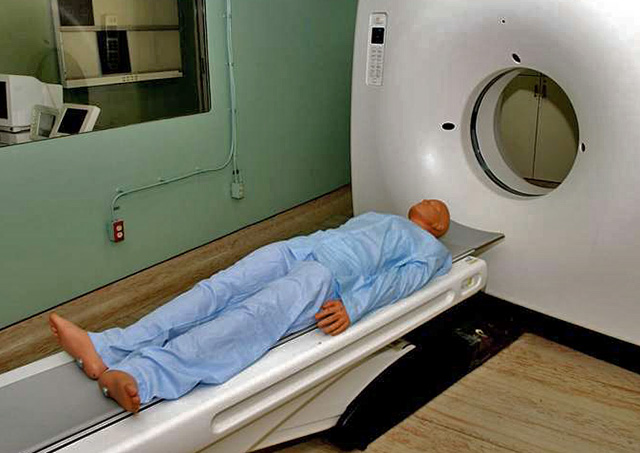 CT Scanner - used for precise body composition analysis
Purpose: To accurately and directly measure body composition, distinguish between intra-abdominal fat and extra-abdominal fat, and calculate indices like Skeletal Muscle Index (SMI) for sarcopenia assessment.
Equipment required: CT Scanner, which is typically a large machine with a tunnel in the center. A movable examination table, on which the patient lies, slides into and out of this tunnel.
Pre-test: Explain the test procedures to the subject. Perform screening of health risks and obtain informed consent. Prepare forms and record basic information such as age, height, body weight, gender, test conditions. See more details of pre-test procedures.
Procedure: An x-ray tube rotates around the subject and sends a beam of photons toward a detector opposite. The data is collected, stored, and applied to complex algorithms to build cross-sectional images of the body, which can further be processed into 3D images. For body composition analysis, a single slice at the L3 vertebra level is typically used.
Results: CT is particularly useful in giving a ratio of intra-abdominal fat to extra-abdominal fat (VAT/SAT ratio), as well as calculating Skeletal Muscle Index (SMI) for sarcopenia assessment.
How to Use This Calculator
Follow these steps to calculate your CT-derived body composition metrics:
- Enter your height and biological sex - These are required to calculate height-normalized indices and apply appropriate sarcopenia thresholds.
- Input your CT measurements - From your CT scan report, enter:
- SMA (Skeletal Muscle Area): Total muscle cross-sectional area at L3 in cm²
- VAT: Visceral adipose tissue area in cm²
- SAT: Subcutaneous adipose tissue area in cm²
- Select your sport context - Athletes in different sports have varying optimal body composition profiles. The calculator provides sport-specific interpretation.
- Review your results - The calculator displays:
- SMI (Skeletal Muscle Index) with sarcopenia risk assessment
- VAT/SAT ratio with metabolic risk interpretation
- VATI and SATI (height-normalized fat indices)
Understanding Your Results
Skeletal Muscle Index (SMI)
SMI standardizes muscle mass for body size by dividing skeletal muscle area (cm²) by height squared (m²). This allows comparison across individuals of different sizes.
Sarcopenia Thresholds (Low Muscle Mass):
- Prado Criteria: Males <52.4 cm²/m², Females <38.5 cm²/m²
- Martin Criteria: Males <53.0 cm²/m², Females <41.0 cm²/m²
- Asian Criteria: Males <40.8 cm²/m², Females <34.9 cm²/m²
VAT/SAT Ratio
The ratio of visceral to subcutaneous fat indicates metabolic health risk:
- <0.8: Normal - lower metabolic risk
- 0.8-1.0: Elevated - moderate metabolic risk
- >1.0: High - increased cardiovascular and metabolic disease risk
VATI (Visceral Adipose Tissue Index)
Height-normalized visceral fat. VATI ≥100 cm²/m² indicates visceral obesity regardless of overall body weight.
CT Body Composition for Athletes
CT analysis provides unique insights for athletic populations:
Power Sports (Weightlifting, Throwing, Football)
Athletes typically show SMI values 20-40% above general population means. Elite powerlifters may have SMI >70 cm²/m². Monitor for excessive visceral fat accumulation during mass-gaining phases.
Endurance Sports (Running, Cycling, Swimming)
Lower absolute muscle mass but excellent muscle quality (high SMRA). VAT/SAT ratios typically <0.5. Useful for monitoring muscle preservation during high-volume training.
Team Sports (Basketball, Soccer, Hockey)
Position-specific variations. Linemen differ from receivers in football; goalkeepers differ from midfielders in soccer. CT helps optimize position-specific body composition.
Combat Sports (Wrestling, MMA, Boxing)
Critical for weight class management. CT distinguishes muscle from fat, helping athletes make weight while preserving lean mass. Monitor muscle quality during weight cuts.
The Science Behind CT Body Composition
Why L3 Vertebra?
Research by Mourtzakis et al. (2008) established that a single CT slice at L3 correlates strongly with whole-body muscle mass (r = 0.92) and fat mass (r = 0.89). This level captures psoas, paraspinal, and abdominal wall muscles along with both fat compartments.
Hounsfield Unit Segmentation
CT differentiates tissues by their density measured in Hounsfield Units (HU):
- Adipose tissue: -190 to -30 HU
- Skeletal muscle: -29 to +150 HU
- Bone: +152 to +1,000 HU
Muscle Quality and Myosteatosis
SMRA (Skeletal Muscle Radiation Attenuation) indicates muscle quality. Fat infiltration within muscle (myosteatosis) lowers SMRA. Values below 30 HU indicate significant myosteatosis, associated with reduced muscle function and poorer clinical outcomes.
Advantages of CT Analysis
- Gold standard accuracy: ±2-3% measurement precision
- Tissue differentiation: Precisely separates muscle, visceral fat, and subcutaneous fat
- Quality assessment: Evaluates muscle density and fat infiltration
- Noninvasive method: No needles or invasive procedures required
- Opportunistic analysis: Can use existing clinical scans
- Regional analysis: Identifies asymmetries or specific muscle groups
Limitations and Considerations
- Radiation exposure: ~3 mSv per abdominal CT, limiting routine monitoring
- High equipment cost: $500-2,500 per scan depending on facility and insurance
- Accessibility: Requires medical imaging facility
- Single slice limitation: L3 analysis assumes proportional body composition
- Hydration effects: Acute dehydration can affect muscle density readings
Note: Due to radiation exposure, CT is typically reserved for baseline assessments or clinical indications rather than frequent monitoring. For routine tracking, consider DEXA scans or bioelectrical impedance.
Other comments: Also known as computed axial tomography or CAT Scans.
Frequently Asked Questions
What is Skeletal Muscle Index (SMI)?
Skeletal Muscle Index (SMI) is calculated by dividing skeletal muscle area at L3 vertebra (in cm²) by height squared (in m²). It provides a standardized measure of muscle mass that accounts for body size, making it useful for comparing muscle mass between individuals of different heights. SMI below established thresholds indicates sarcopenia (low muscle mass).
What is a healthy VAT/SAT ratio?
A VAT/SAT ratio below 0.8 is considered healthy and indicates more subcutaneous than visceral fat storage. Ratios between 0.8-1.0 suggest elevated metabolic risk, while ratios above 1.0 indicate high visceral fat accumulation associated with increased cardiovascular disease risk, insulin resistance, and metabolic syndrome.
At what SMI is sarcopenia diagnosed?
Sarcopenia thresholds vary by population and criteria used. The Prado criteria (commonly used in oncology) define sarcopenia as SMI <52.4 cm²/m² for males and <38.5 cm²/m² for females. Martin criteria use <53 cm²/m² (males) and <41 cm²/m² (females). Asian populations use lower thresholds: <40.8 cm²/m² (males) and <34.9 cm²/m² (females).
Why is L3 vertebra level used?
The L3 vertebra level was validated through research showing strong correlations (r = 0.89-0.99) between single-slice measurements and whole-body composition. This level captures major muscle groups (psoas, paraspinal, abdominal wall) and both fat compartments, providing representative whole-body estimates while minimizing radiation exposure.
How accurate is CT for body composition?
CT is considered the gold standard with measurement accuracy of ±2-3% for muscle and fat quantification. It precisely differentiates tissues using Hounsfield Units and provides higher accuracy than DEXA, BIA, or skinfold measurements. However, accuracy depends on proper imaging protocols and analysis software.
What is myosteatosis and why does it matter?
Myosteatosis is fat infiltration within skeletal muscle, detected by low SMRA (Skeletal Muscle Radiation Attenuation) values on CT. SMRA below 30 HU indicates significant myosteatosis. This fat infiltration reduces muscle quality and contractile function, and is associated with poorer clinical outcomes, reduced strength, and increased mortality risk.
Can CT body composition be used for athlete monitoring?
Yes, but with limitations. CT provides highly accurate baseline assessments and is valuable for research. However, radiation exposure (~3 mSv per scan) limits routine monitoring. For ongoing athlete assessment, DEXA or BIA are preferred for frequent measurements, with occasional CT scans for detailed analysis or validation.
References
- Mourtzakis, M., et al. (2008). "A practical and precise approach to quantification of body composition in cancer patients using computed tomography images acquired during routine care." Applied Physiology, Nutrition, and Metabolism, 33(5), 997-1006.
- Prado, C.M., et al. (2008). "Prevalence and clinical implications of sarcopenic obesity in patients with solid tumours of the respiratory and gastrointestinal tracts." Lancet Oncology, 9(7), 629-635.
- Martin, L., et al. (2013). "Cancer cachexia in the age of obesity: skeletal muscle depletion is a powerful prognostic factor." Journal of Clinical Oncology, 31(12), 1539-1547.
- Shen, W., et al. (2004). "Total body skeletal muscle and adipose tissue volumes: estimation from a single abdominal cross-sectional image." Journal of Applied Physiology, 97(6), 2333-2338.
- Cruz-Jentoft, A.J., et al. (2019). "Sarcopenia: revised European consensus on definition and diagnosis." Age and Ageing, 48(1), 16-31.
- Aubrey, J., et al. (2014). "Measurement of skeletal muscle radiation attenuation and basis of its biological variation." Acta Physiologica, 210(3), 489-497.
- Mitsiopoulos, N., et al. (1998). "Cadaver validation of skeletal muscle measurement by magnetic resonance imaging and computerized tomography." Journal of Applied Physiology, 85(1), 115-122.
- van Vugt, J.L., et al. (2017). "A comparative study of software programmes for cross-sectional skeletal muscle and adipose tissue measurements on abdominal CT images." Clinical Physiology and Functional Imaging, 37(4), 420-427.
Similar Tests
- Magnetic Resonance Imaging (MRI) - No radiation, excellent soft tissue contrast
- Dual-Energy X-Ray Absorptiometry (DEXA) - Lower radiation, whole-body analysis
- Near Infrared Interactance - Portable, no radiation
- Bioelectrical Impedance Analysis (BIA) - Accessible, frequent monitoring